
Reports & Analytics
Every major feature reports on itself under Reports. All figures are workspace-scoped, and every page starts with the same From / To date pickers plus 7d / 30d / 90d shortcuts. You, as the platform owner, see cross-tenant numbers in the admin dashboard instead.
Inbox & agent performance
Reports → Inbox. The service-quality view.
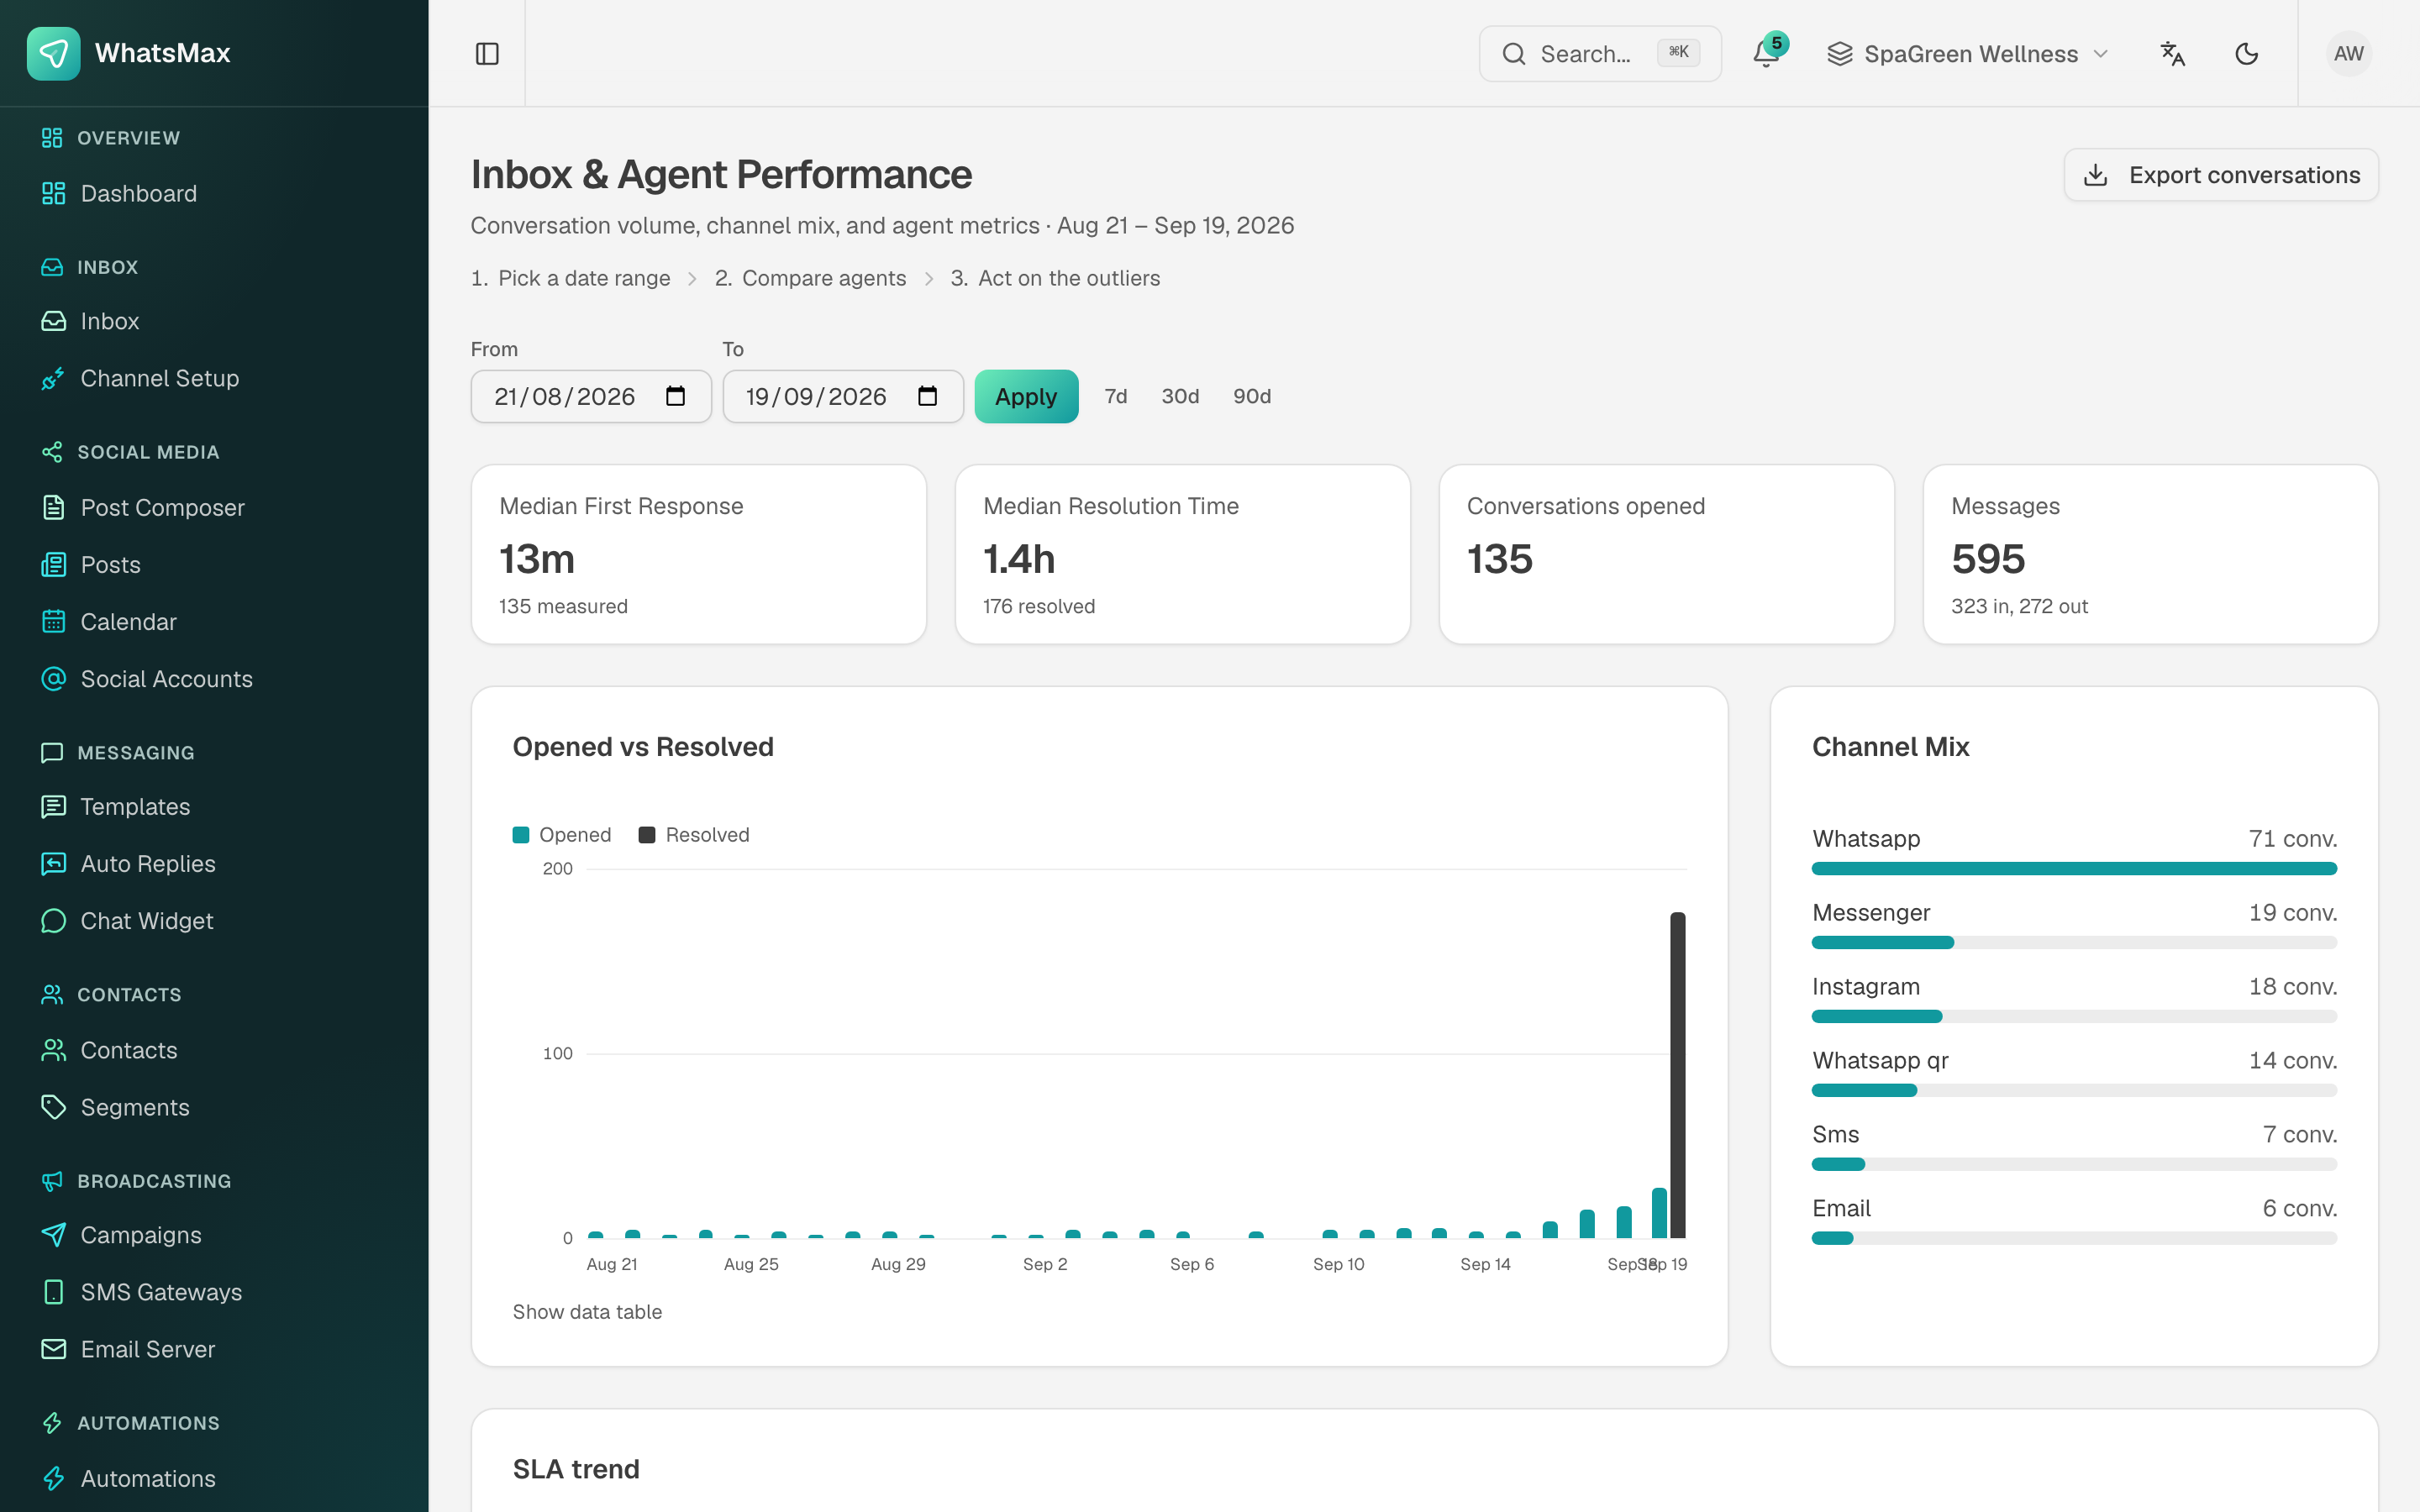 Response times, opened vs resolved, and the channel mix over the selected range.
| Metric | Read it as |
|---|---|
| Median first response | How long a customer waits for the first human (or bot) reply. The number to manage. |
| Median resolution time | How long a conversation stays open before it is resolved. |
| Conversations opened | New threads in the range. |
| Messages | Split inbound / outbound. A high outbound-to-inbound ratio usually means agents are chasing. |
| Opened vs resolved | If opened consistently beats resolved, the queue is growing. |
| Channel mix | Which channels the demand actually comes from — often a surprise. |
| SLA trend | First-response performance over time. |
| Per-agent table | Volume and response time per agent, for coaching rather than league tables. |
Export conversations downloads the raw data for the range.
Campaign reports
Reports → Campaigns lists every campaign with its delivery funnel; open one for the per-message detail.
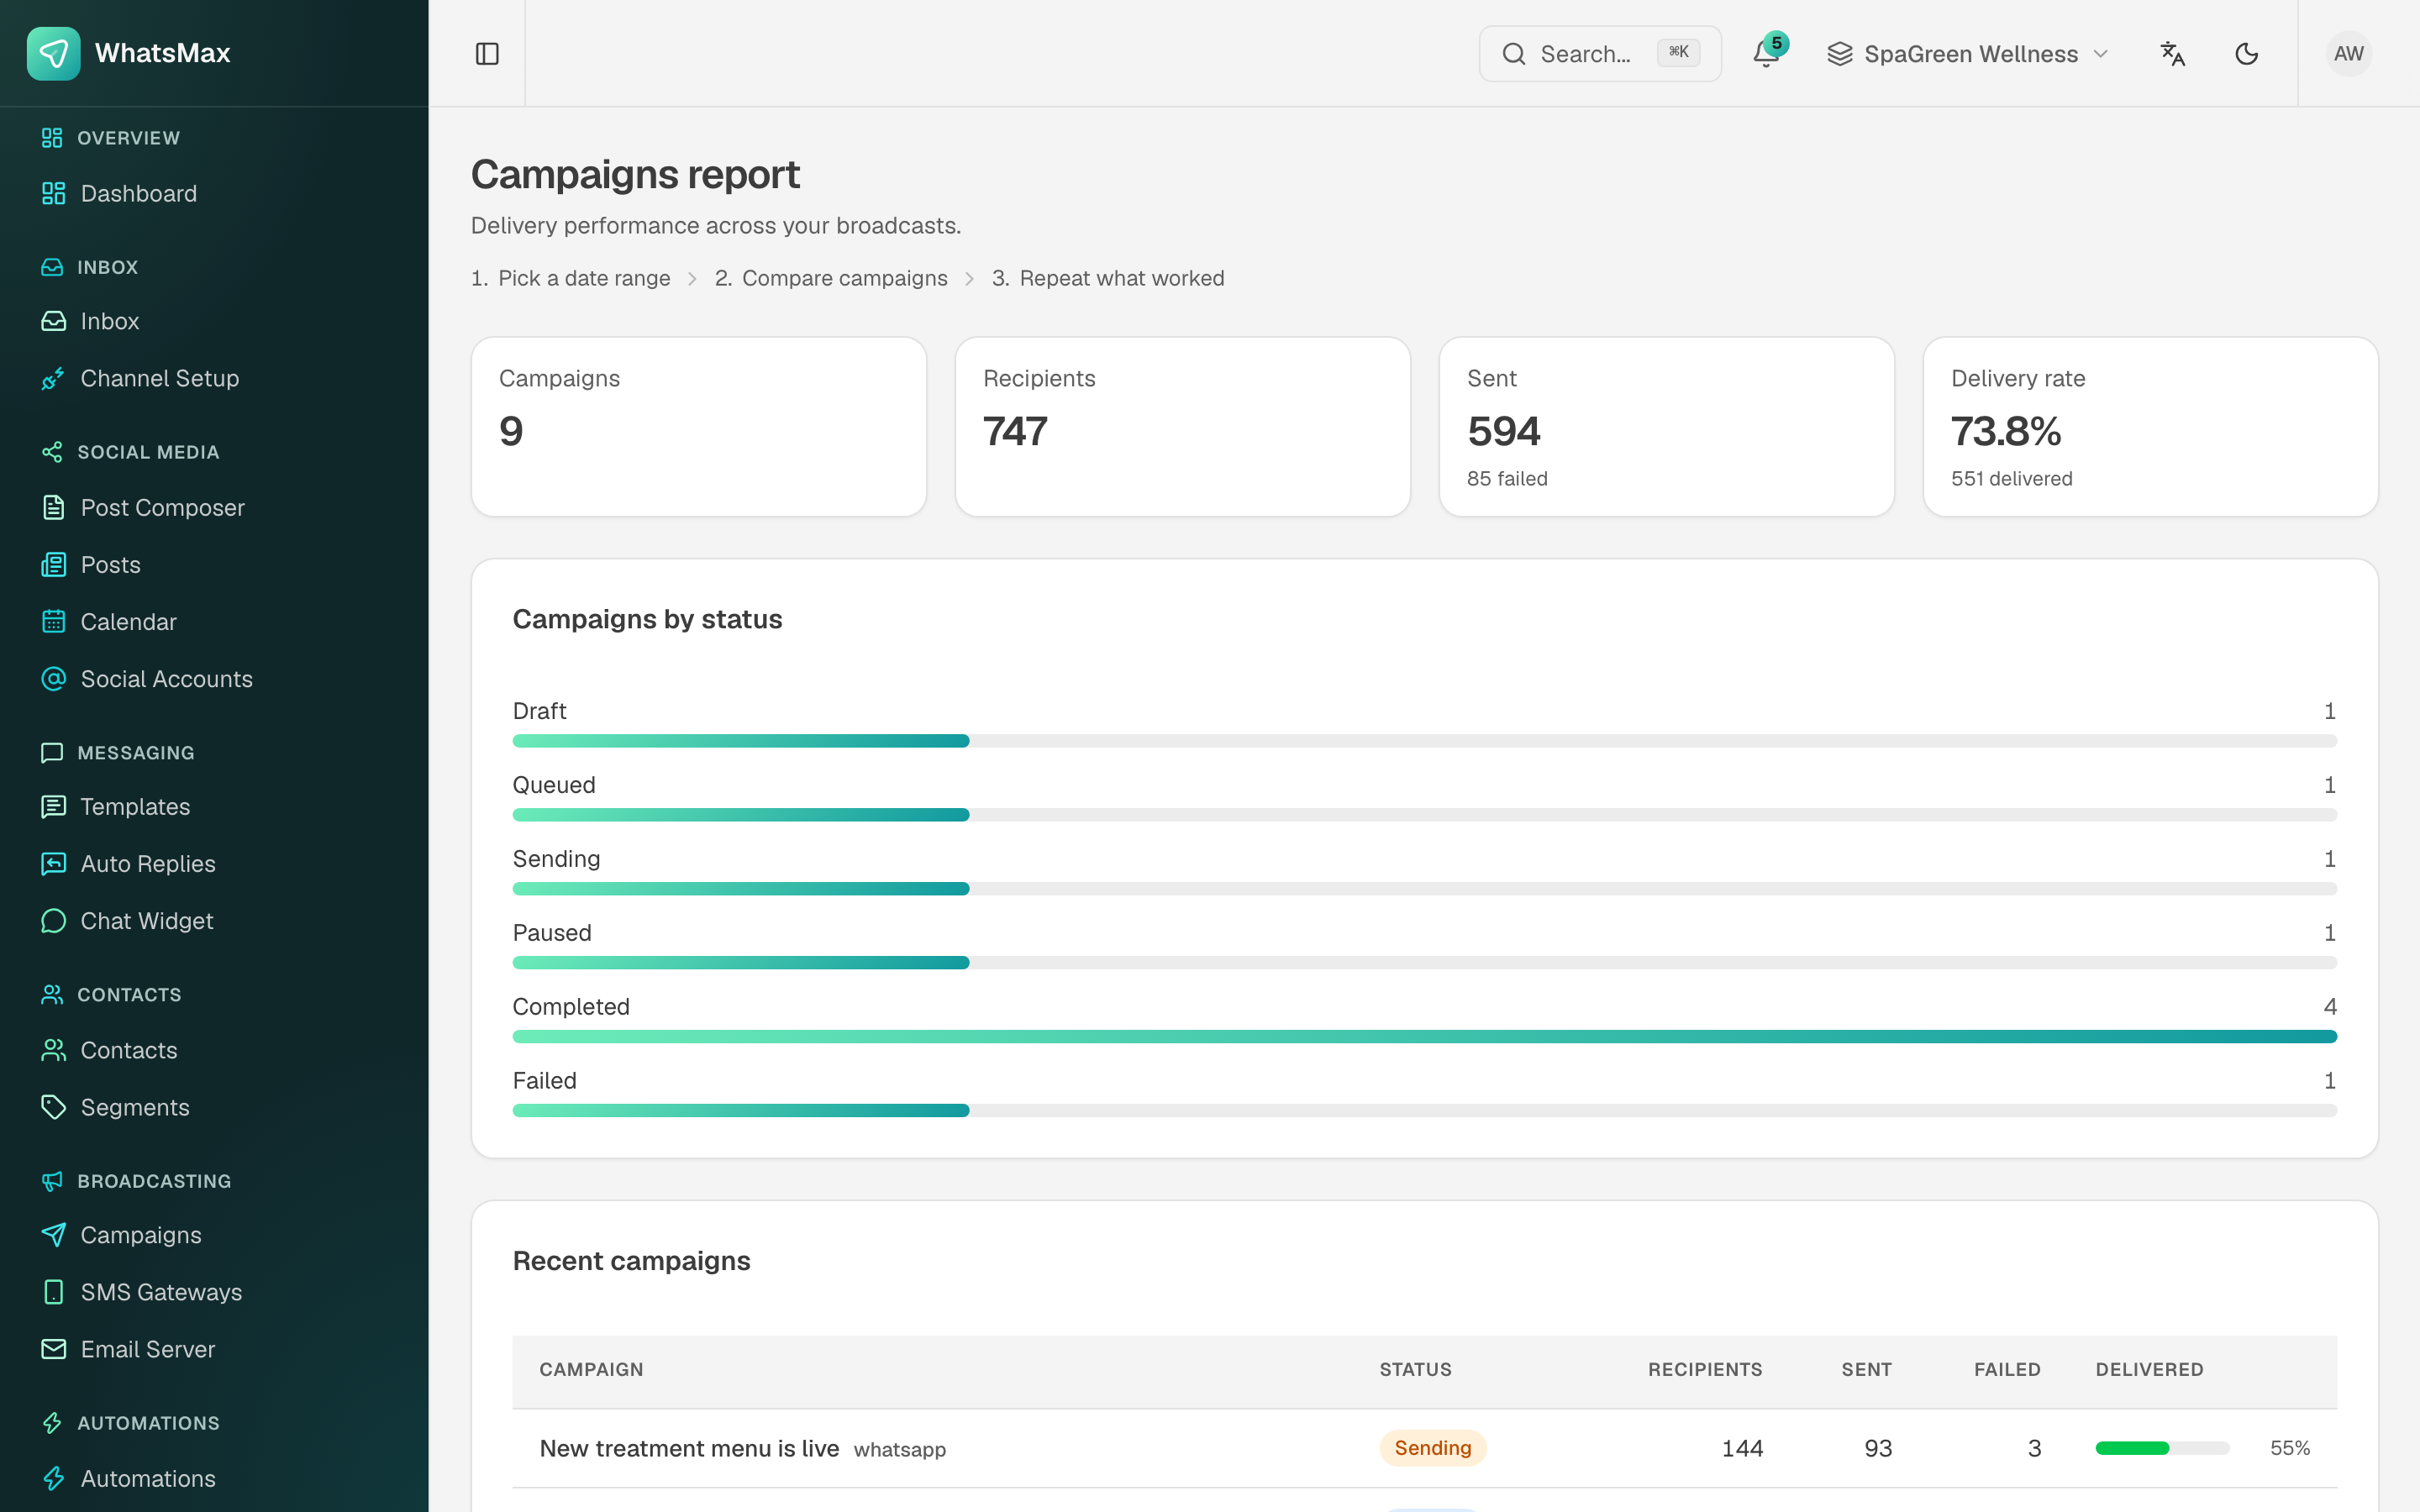 Campaign delivery performance.
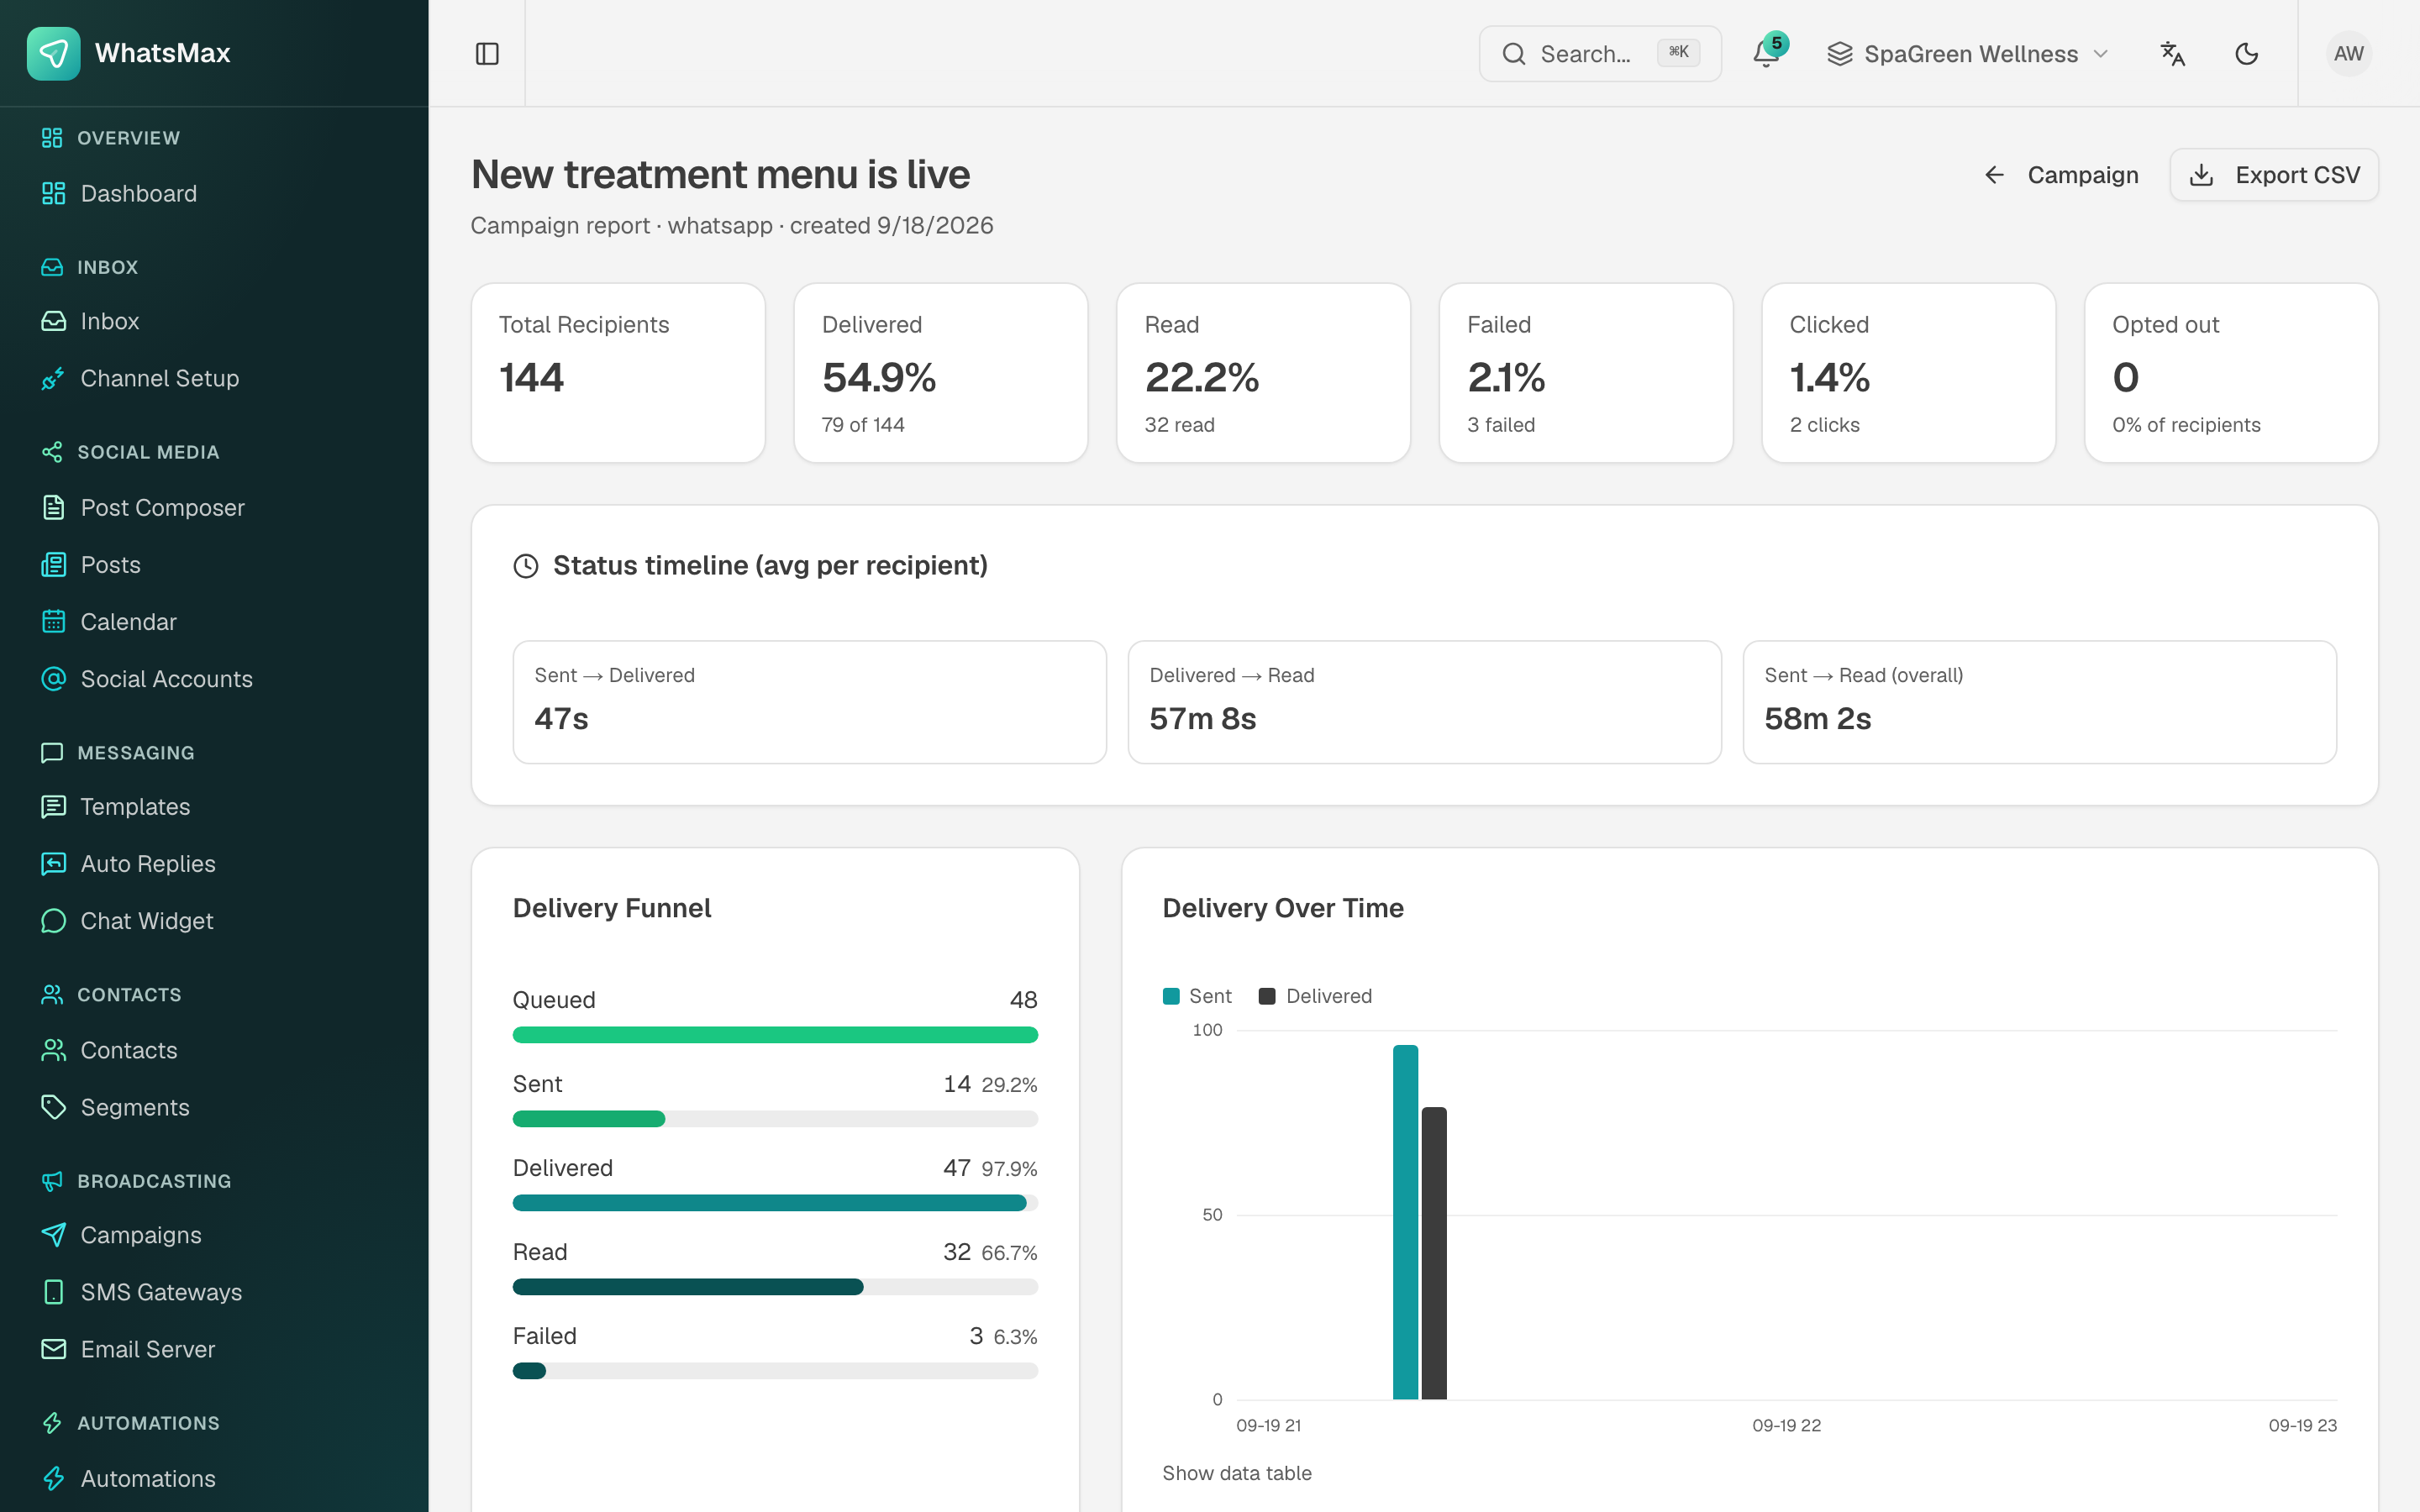 A single campaign's report — funnel, timing and delivery over time.
A campaign report gives you:
- Headline rates — total recipients, delivered, read, failed, clicked and opted out. Watch the opt-out rate: it is the early warning that the audience or the message is wrong, long before WhatsApp throttles the number.
- Status timeline — average sent → delivered, delivered → read, and sent → read. Slow delivery points at the channel; slow reads point at send time of day.
- Delivery funnel — queued → sent → delivered → read → failed, with counts and percentages.
- Delivery over time — the send pacing, which is what to look at when a campaign seems stuck.
- Export CSV for the per-recipient detail. SMS delivery states only appear if the gateway's delivery-report webhook is wired up.
Automation reports
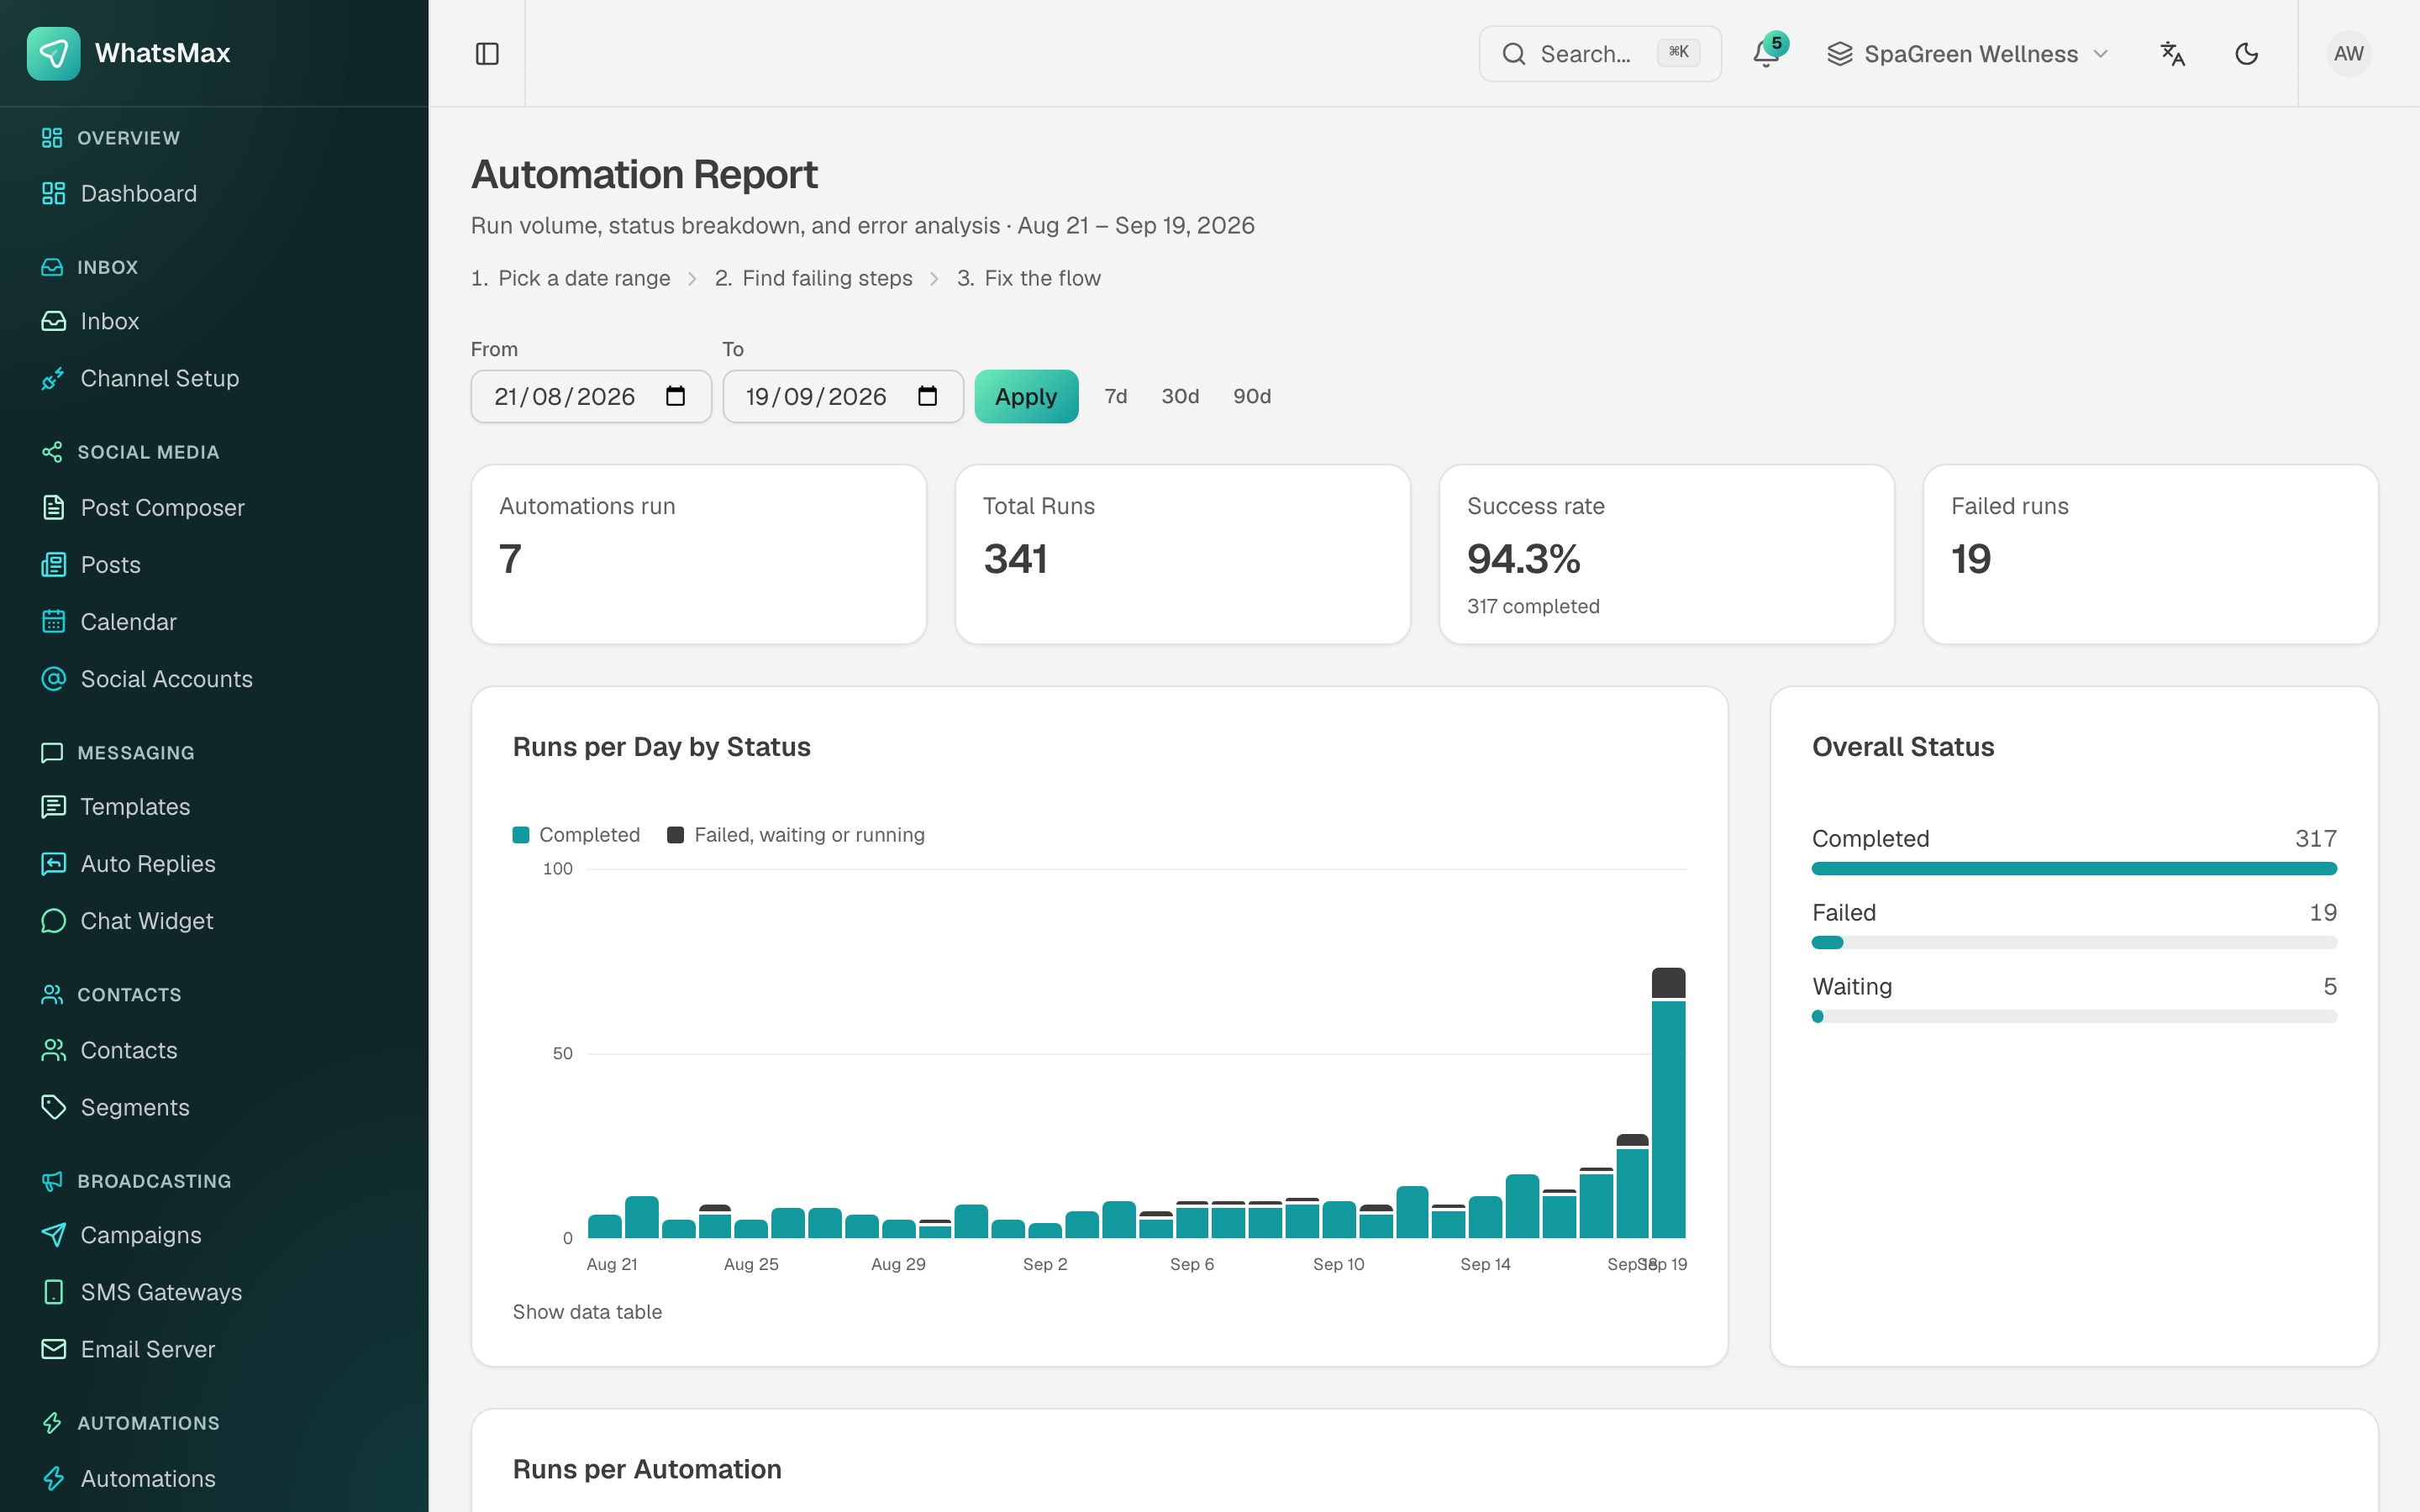 Run volume, success rate and the status breakdown.
Reports → Automations gives you automations run, total runs, success rate and failed runs, then runs per day by status, an overall status breakdown (completed / failed / waiting) and runs per automation.
A flow that "does nothing" shows up here in one of two shapes: it has no runs at all, which means the trigger never fires, or it has runs that all end in failed, which means a step is broken. Open the automation's own Runs view for the per-run error.
AI usage
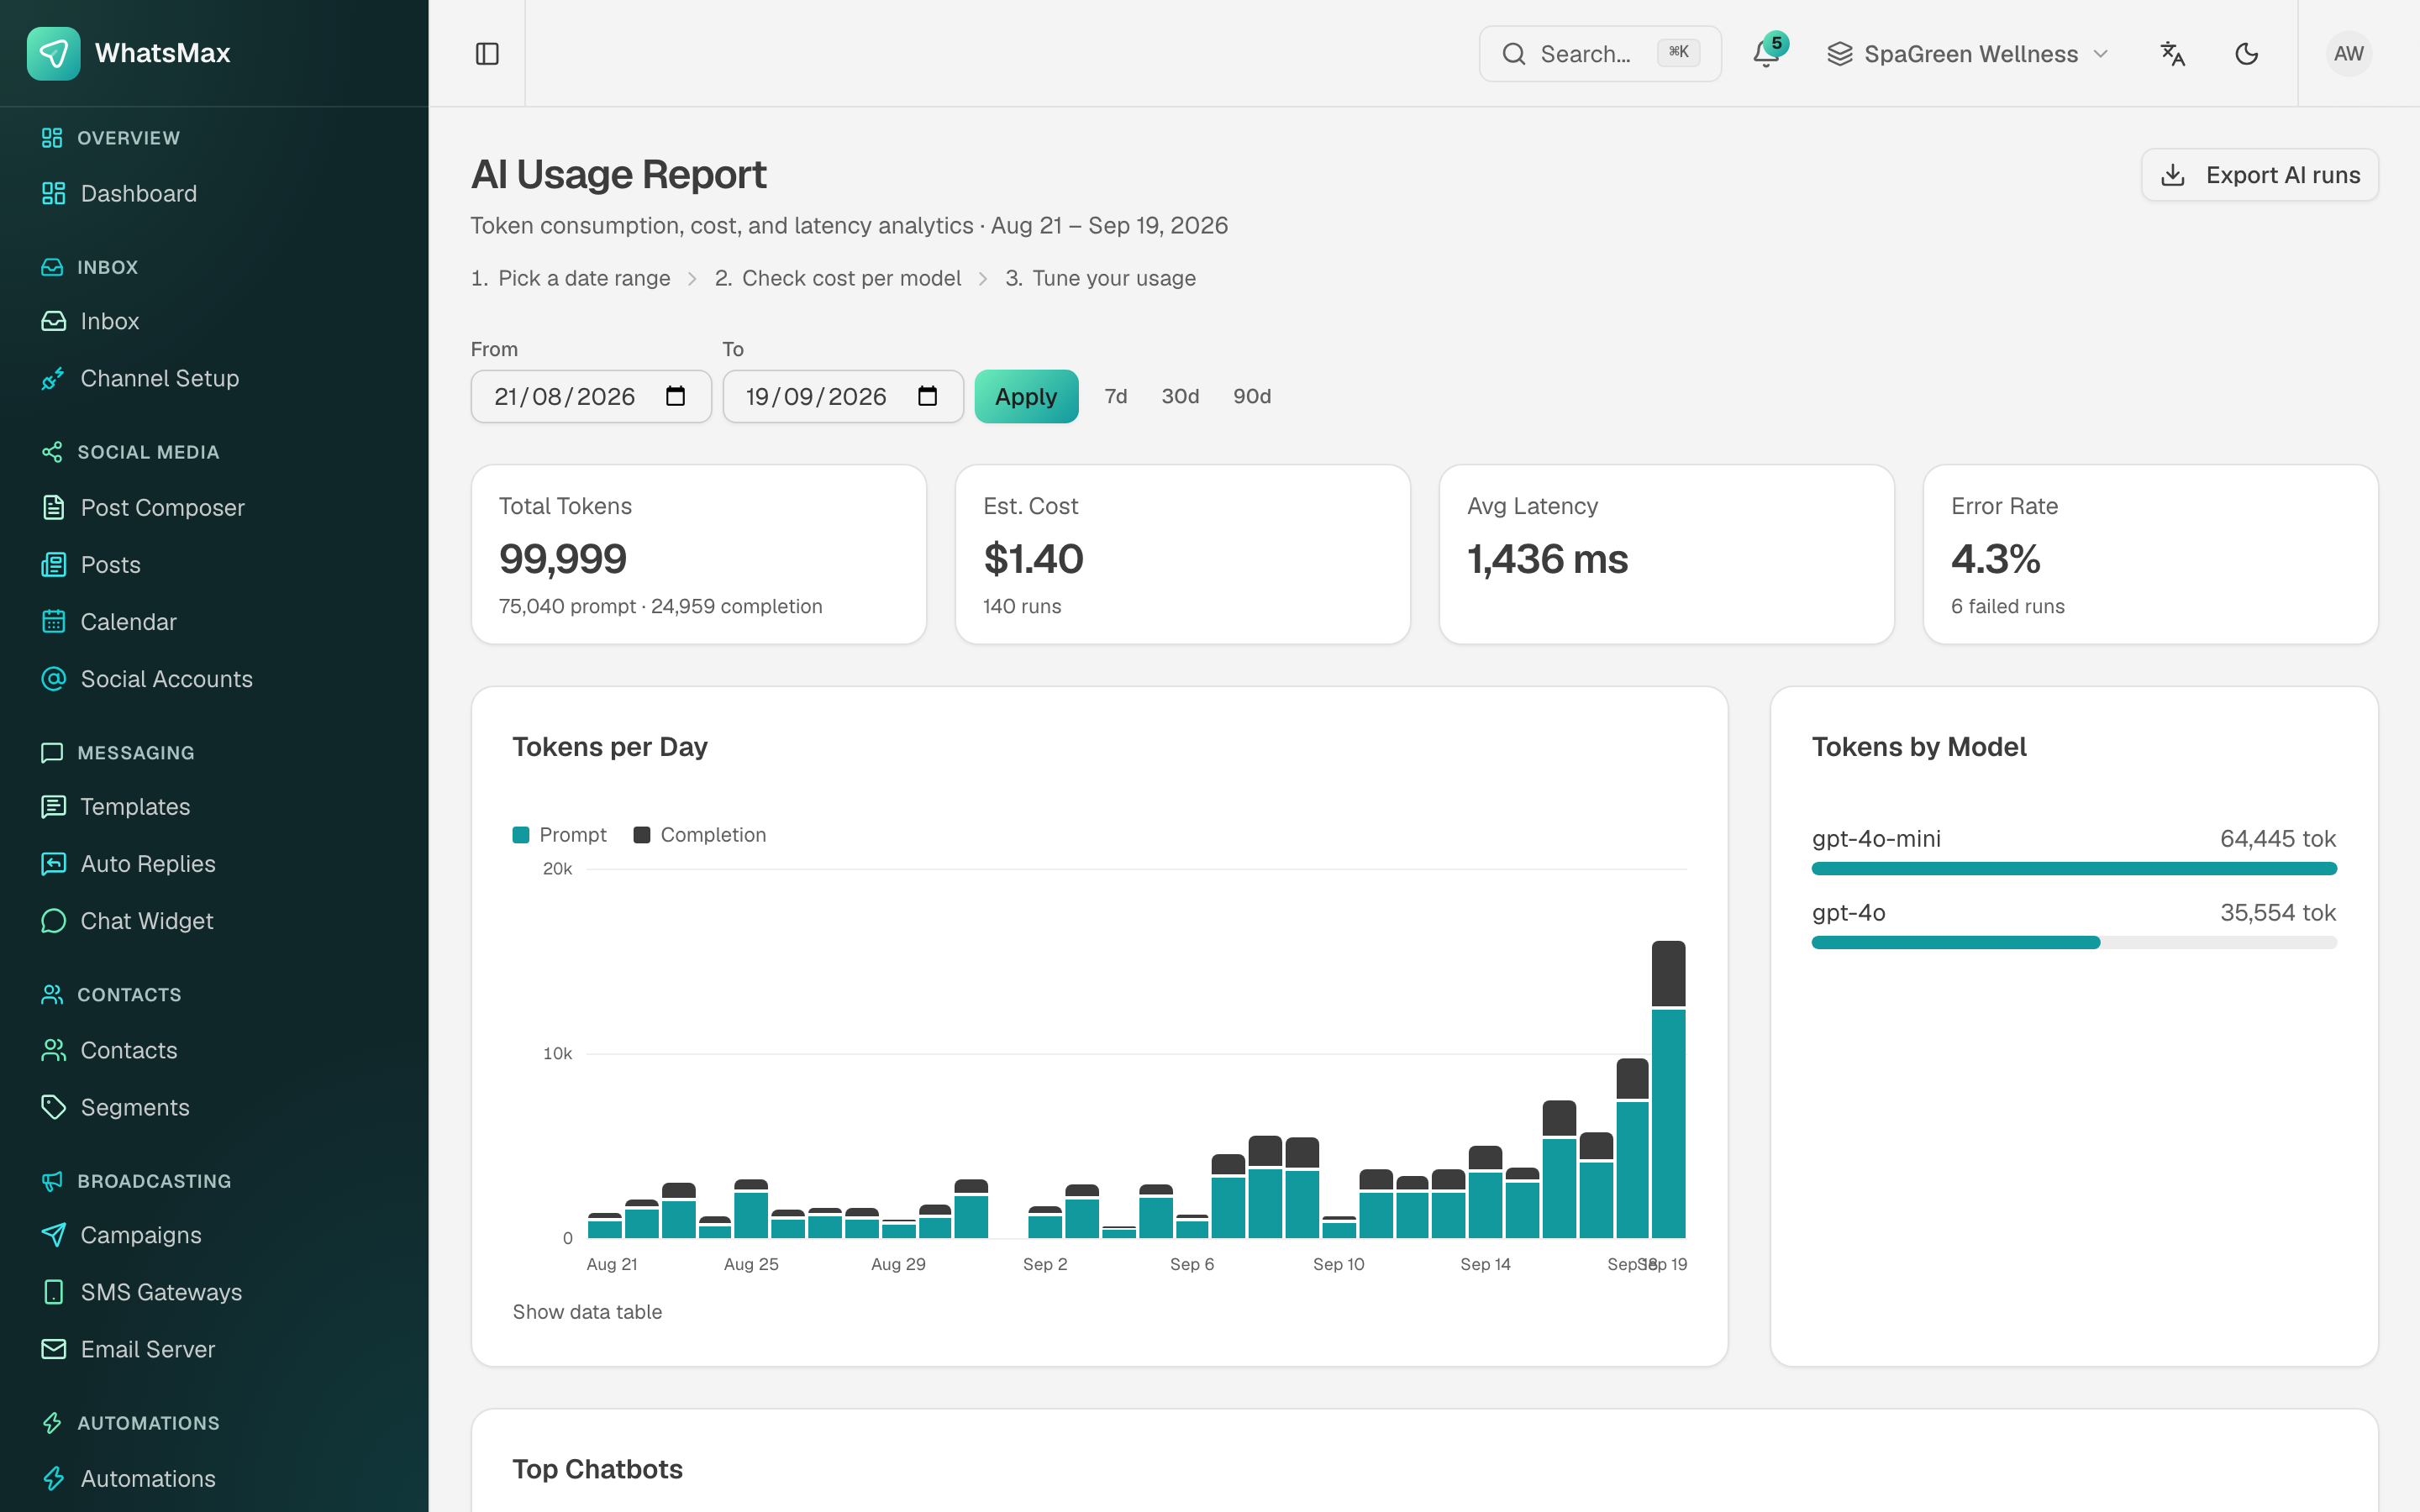 Tokens, estimated cost, latency and error rate, with the model split.
Reports → AI shows total tokens (split prompt vs completion), estimated cost, average latency and error rate, then tokens per day, tokens by model and top chatbots. Export AI runs gives you the raw rows.
Two things to watch: a rising error rate usually means a rate-limited or out-of-credit provider key, and a large share of tokens on an expensive model usually means a chatbot that could do the same job on a smaller one.
Platform-wide AI usage across all tenants is in Admin → AI Dashboard, and you can cap it per plan — see AI Providers.
Social performance
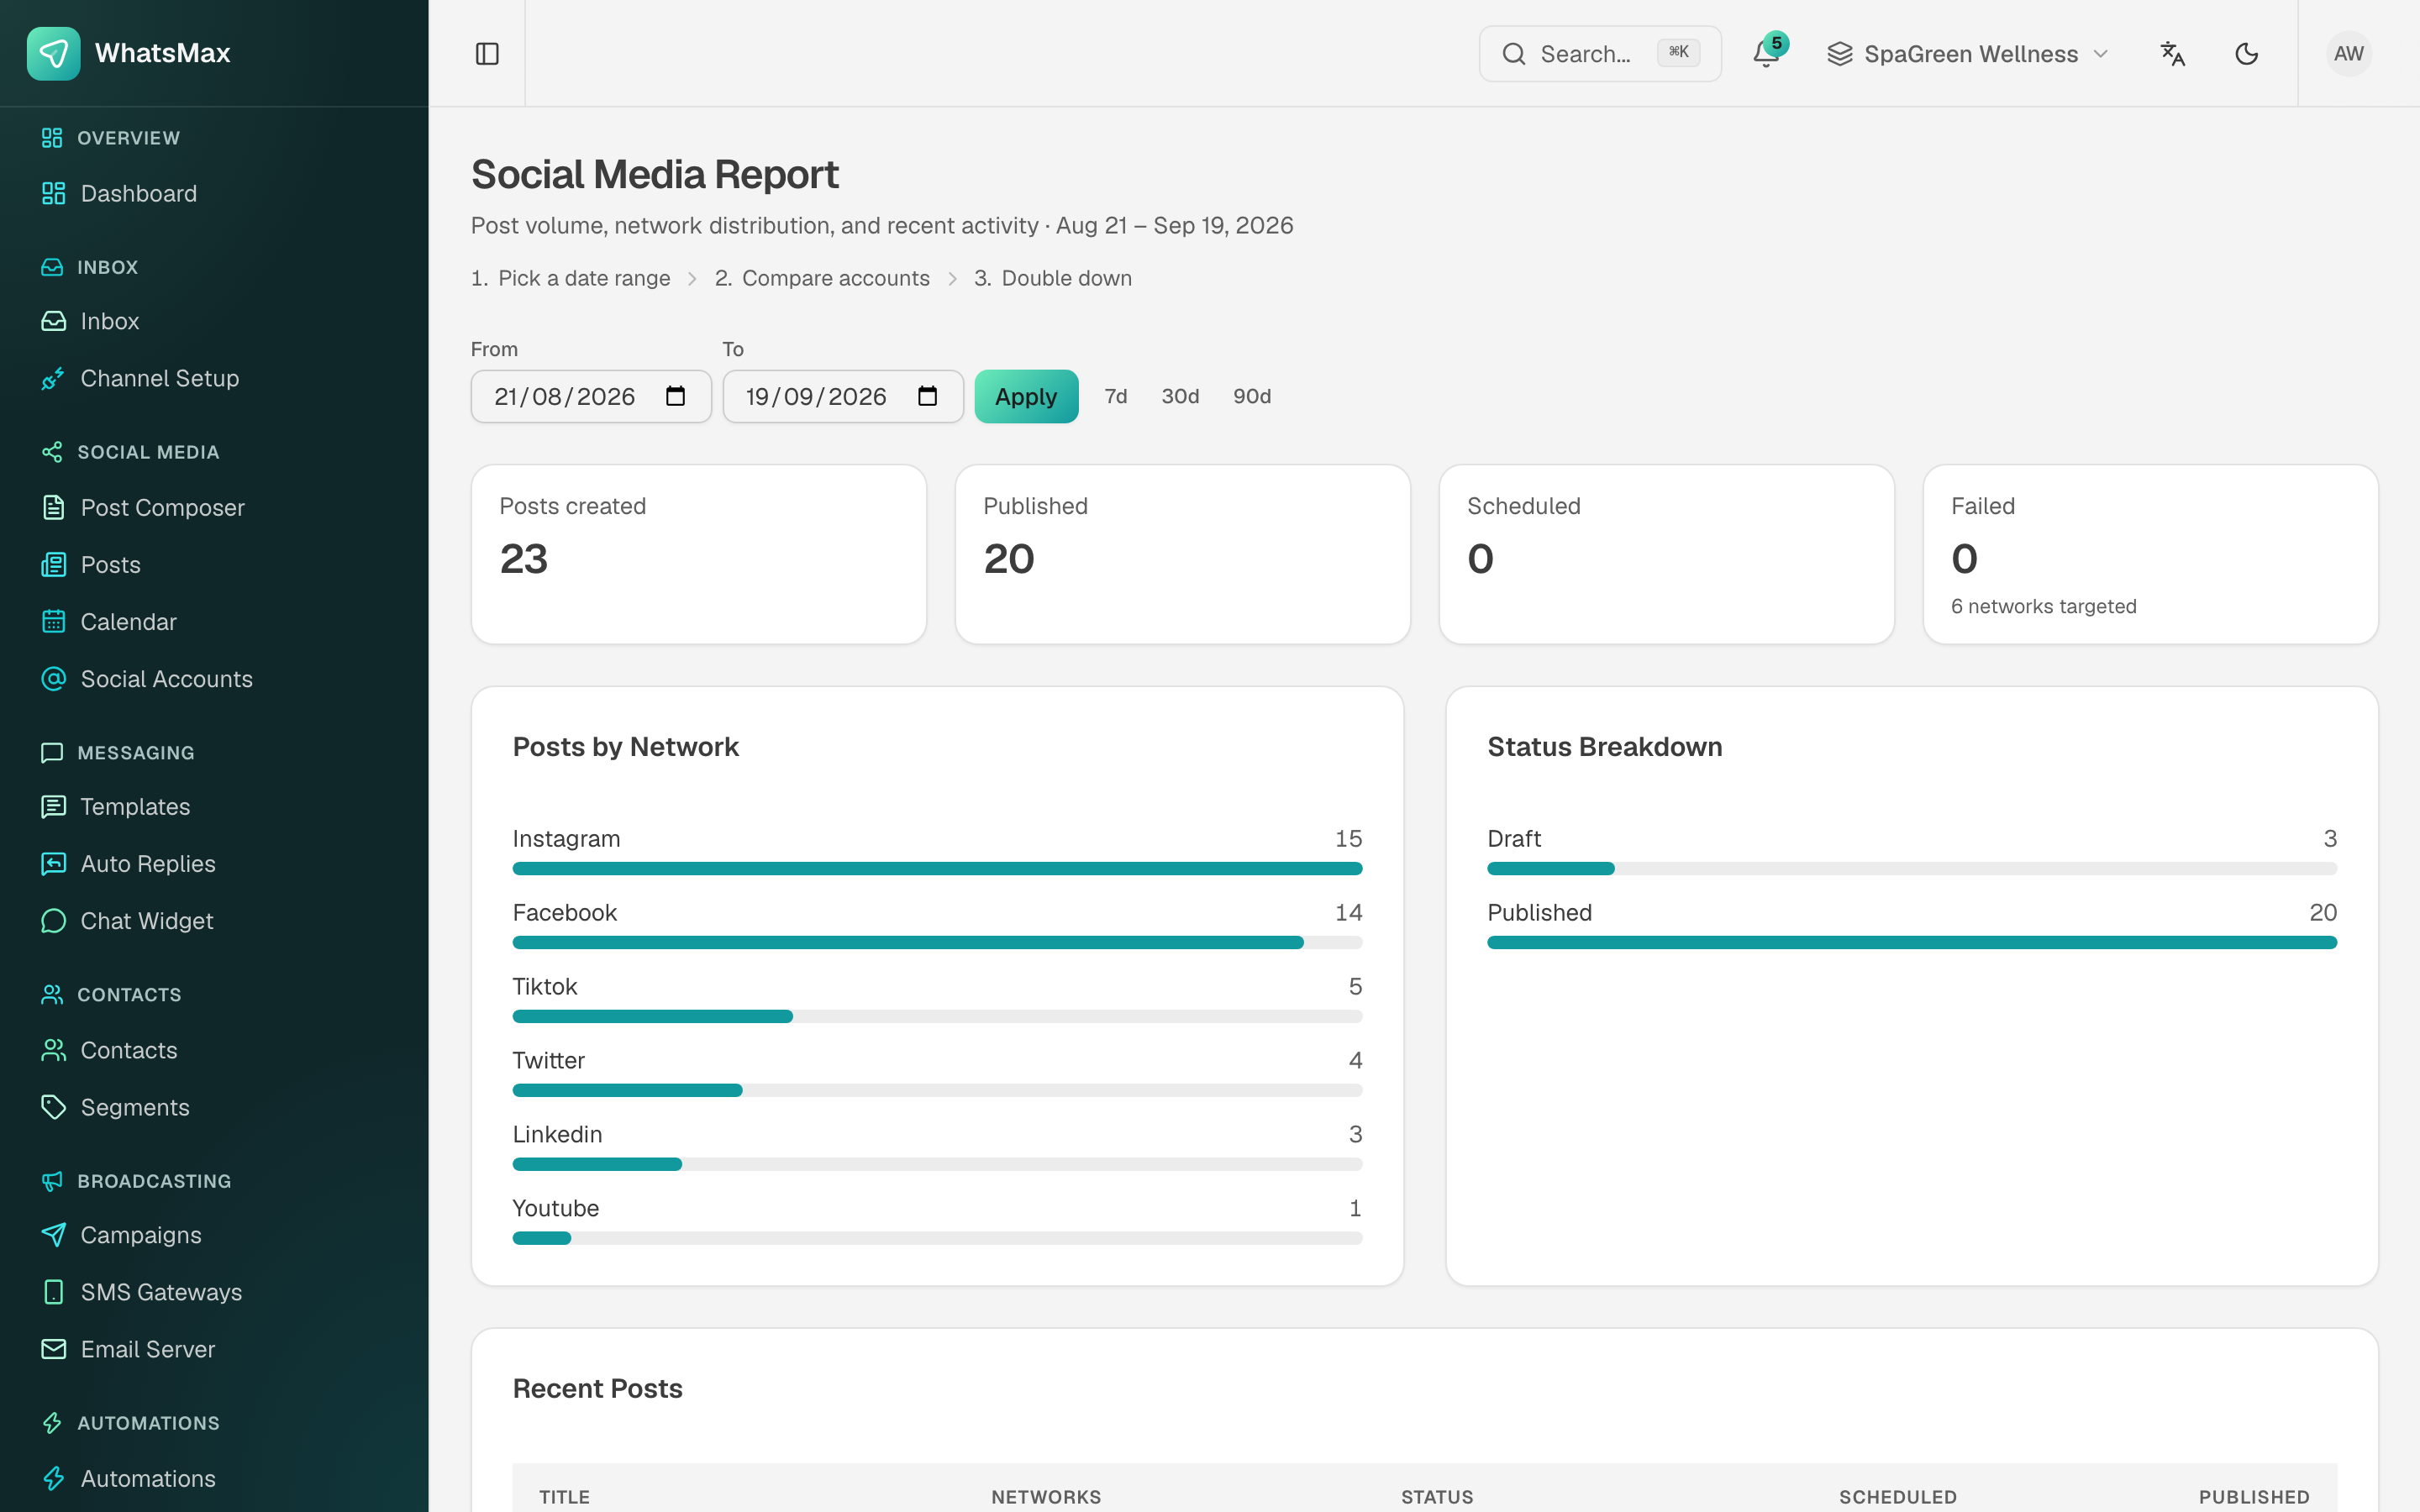 Volume by network and by status.
Reports → Social counts posts created, published, scheduled and failed for the range, then breaks them down by network and by status, with a recent-posts table. It answers "are we actually posting, and where?" — a failed count above zero is the cue to check Social Accounts for an expired connection.
Reports lag behind the worker
Report figures are built from what has actually been processed. If the worker has been down, numbers will look wrong until the backlog drains — check Admin → System → Queue before believing a sudden drop.